
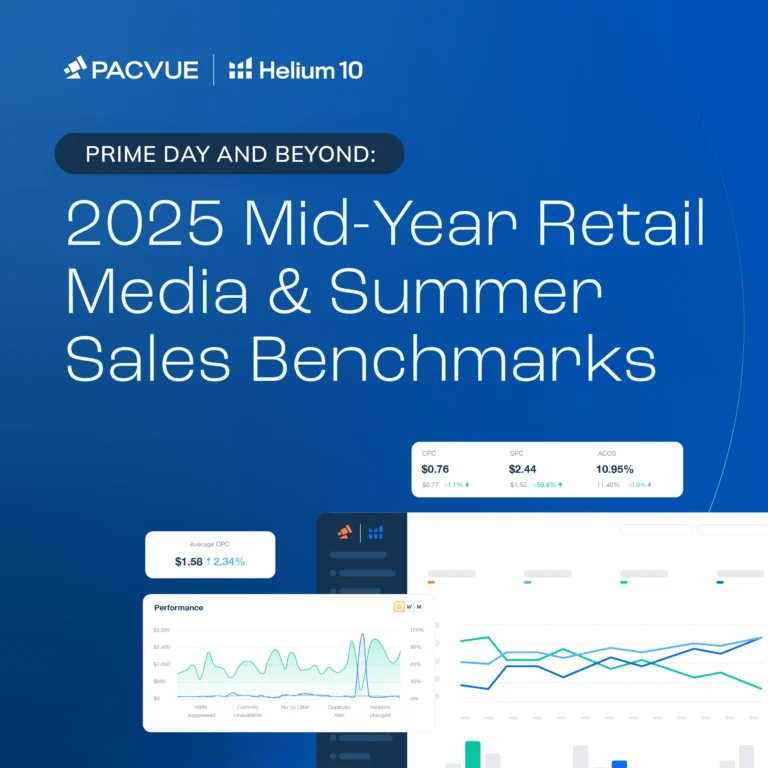
Prime Day and Beyond: 2025 Mid-Year US Retail Media & Summer Sales Benchmarks
Discover how you performed during Prime Day and this summer’s retail media events.
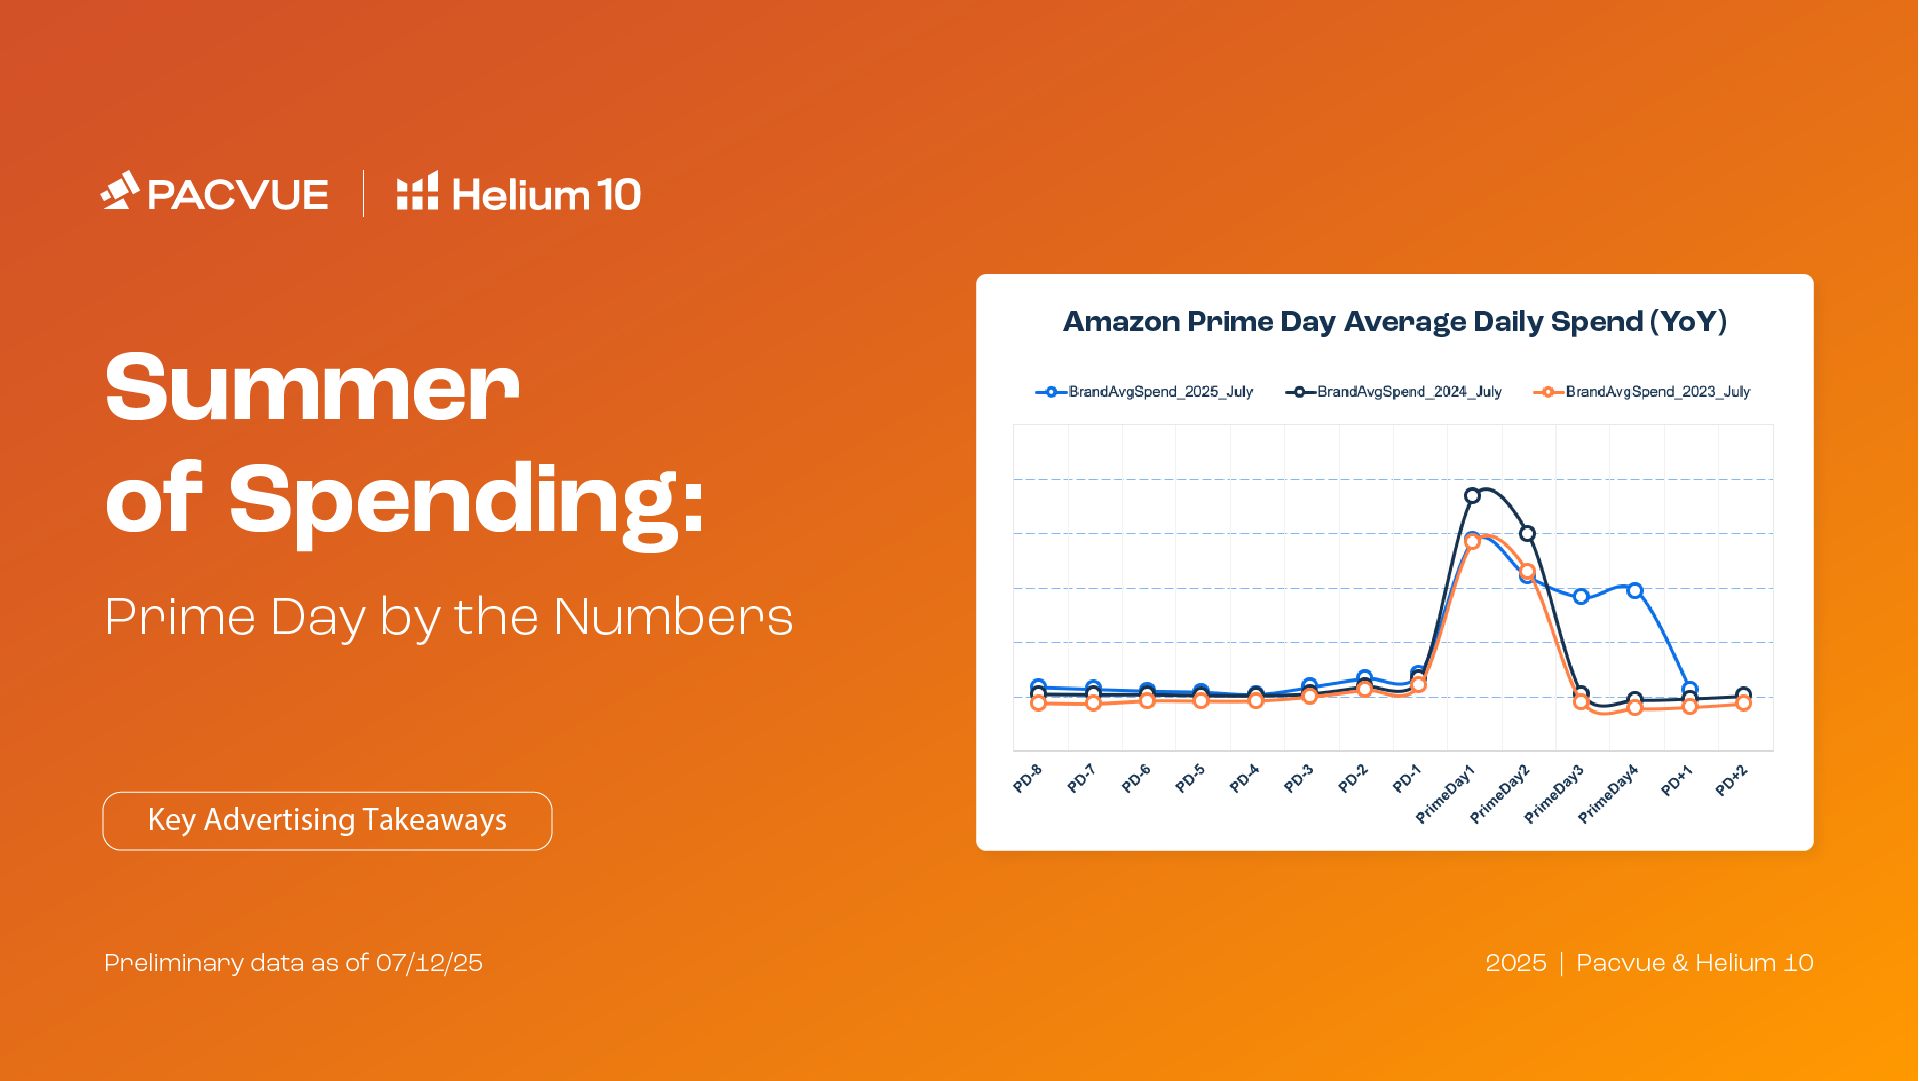
Our 2025 Mid-Year US Retail Media & Summer Sales Benchmark Report delivers a deep dive into summer sales performance across Amazon and other major marketplaces, spotlighting where advertisers invested, which strategies paid off, and how brands adapted to the rapidly changing retail media landscape across the region. Learn what drove results for Prime Day and other key sales events—and what these insights mean for your strategy as you plan for the rest of 2025.
You’ll gain access to comprehensive benchmarks powered by Pacvue, including insights on Prime Day, CPC, ROAS, and more, drawn from thousands of advertisers and billions in ad spend. Use these data-driven insights to optimize your campaigns, compare your results to industry leaders in the US, and stay ahead of the competition as retail media continues to evolve.

Prime Day US Trends
Although brands expanded their budgets to accommodate the longer Prime Day period, they front-loaded their spend on Amazon to prioritize the first day of this promotional window, driving the greatest sales and ROAS on Day 1.

Amazon Ads US Trends
Brands increased their average daily spend QoQ on Amazon for both Sponsored Brands (+4.2%) and Sponsored Products (+7.8%), investing more in advertising to maintain sales in the face of new import tariffs.

Walmart Connect Trends
Drawn to lower CPCs (-15%) and improved Sponsored Brands ROAS (+21.4%) QoQ, Walmart advertisers increased their average daily spend QoQ (+12.4%) and YoY (+37.8%) to capitalize on higher returns and lower acquisition costs.

Instacart Ads Trends
Although CPC remained almost flat QoQ (+1.15%) and fell slightly YoY (-2.2%) while CTR rose (+7.1%) QoQ, brands saw diminishing ROAS on both a quarterly (-4.3%) and yearly (-5.4%) basis, which prompted them to reduce their average daily spend QoQ (-3.4%) and YoY (-11.4%).
Category Trends
Improving 8.3% YoY to $11.73 in Q2 2025, Electronics generated the highest ROAS across Amazon’s 15 categories, while Health & Household’s average daily spend increased nearly 25% YoY—tied with Beauty & Personal Care for the strongest YoY spend growth.