Amazon and Walmart have quickly become the two primary eCommerce advertising platforms for many brands, with Walmart’s eCommerce business growing 74% during the pandemic.
In a previous post, we covered how it’s not feasible to replicate your Amazon ad strategy on Walmart and achieve success. The same can be said about comparing performance metrics on both platforms.
Although the metrics you will find on both Amazon and Walmart are similar, two major aspects affect how they are calculated: attribution models and Walmart’s unique position as a relatively new advertising platform.
In this article, we’ll go over both aspects in detail and recommend a few ways you can benchmark your performance on Walmart compared to Amazon.
-Aug-13-2020-12-42-04-93-AM.png)
How Sales Attribution Models Work on Amazon vs Walmart
The attribution windows vary quite a bit between the two platforms. Both Amazon and Walmart offer a 3-day and a 30-day attribution window, and Amazon also provides attribution windows of 1-day, 14-days, and 30-days.
As a default, Amazon offers a 14-day attribution window, which includes only clicks. This means that a sale will be included in the attribution window only if a customer purchases from your ad within 14 days of clicking on it. However, Amazon also includes clicks and sales on related products of the same brand.
At Walmart, on the other hand, clicks and sales work a little bit differently. If a customer views your ad without clicking but purchases from your brand within the next 30 days, the sale will be included in the default 30-day attribution window.
How Walmart Differs from Other Platforms
Walmart’s self-service advertising platform is still new and competition is minimal. Therefore, it’s easy to drive a large amount of impressions with a very low CPC compared to Amazon. However, this can conversely result in much lower click-through rates on Walmart compared to Amazon.
As you ramp up your advertising campaigns on Walmart, focus on improving visibility and Share of Voice (how often your products are showing up on given search terms), as well as your overall growth of orders. Similarly, pay close attention to your conversion rates to make sure you’re driving the right traffic to your product pages.
Finally, many brands are seeing a difference in the types of products that are successful on Walmart versus Amazon. This is in part driven by differences in the average Walmart consumer and their shopping habits, where lower-priced items tend to be more successful, but it’s also driven by Walmart’s advertising requirements. For example, products must show up in the top 128 organic results to be eligible for advertising on a given search term, meaning brands tend to prioritize their hero products in Walmart campaigns.
Benchmarking Performance on Walmart and Amazon
Given these differences, simply comparing return on ad spend (ROAS) can result in dramatically different metrics across Amazon and Walmart. For example, one brand found their Laundry and Home Care product line had a 44% higher ROAS on Walmart compared to Amazon. However, their Beauty line showed Amazon with a 39% ROAS improvement over Walmart.
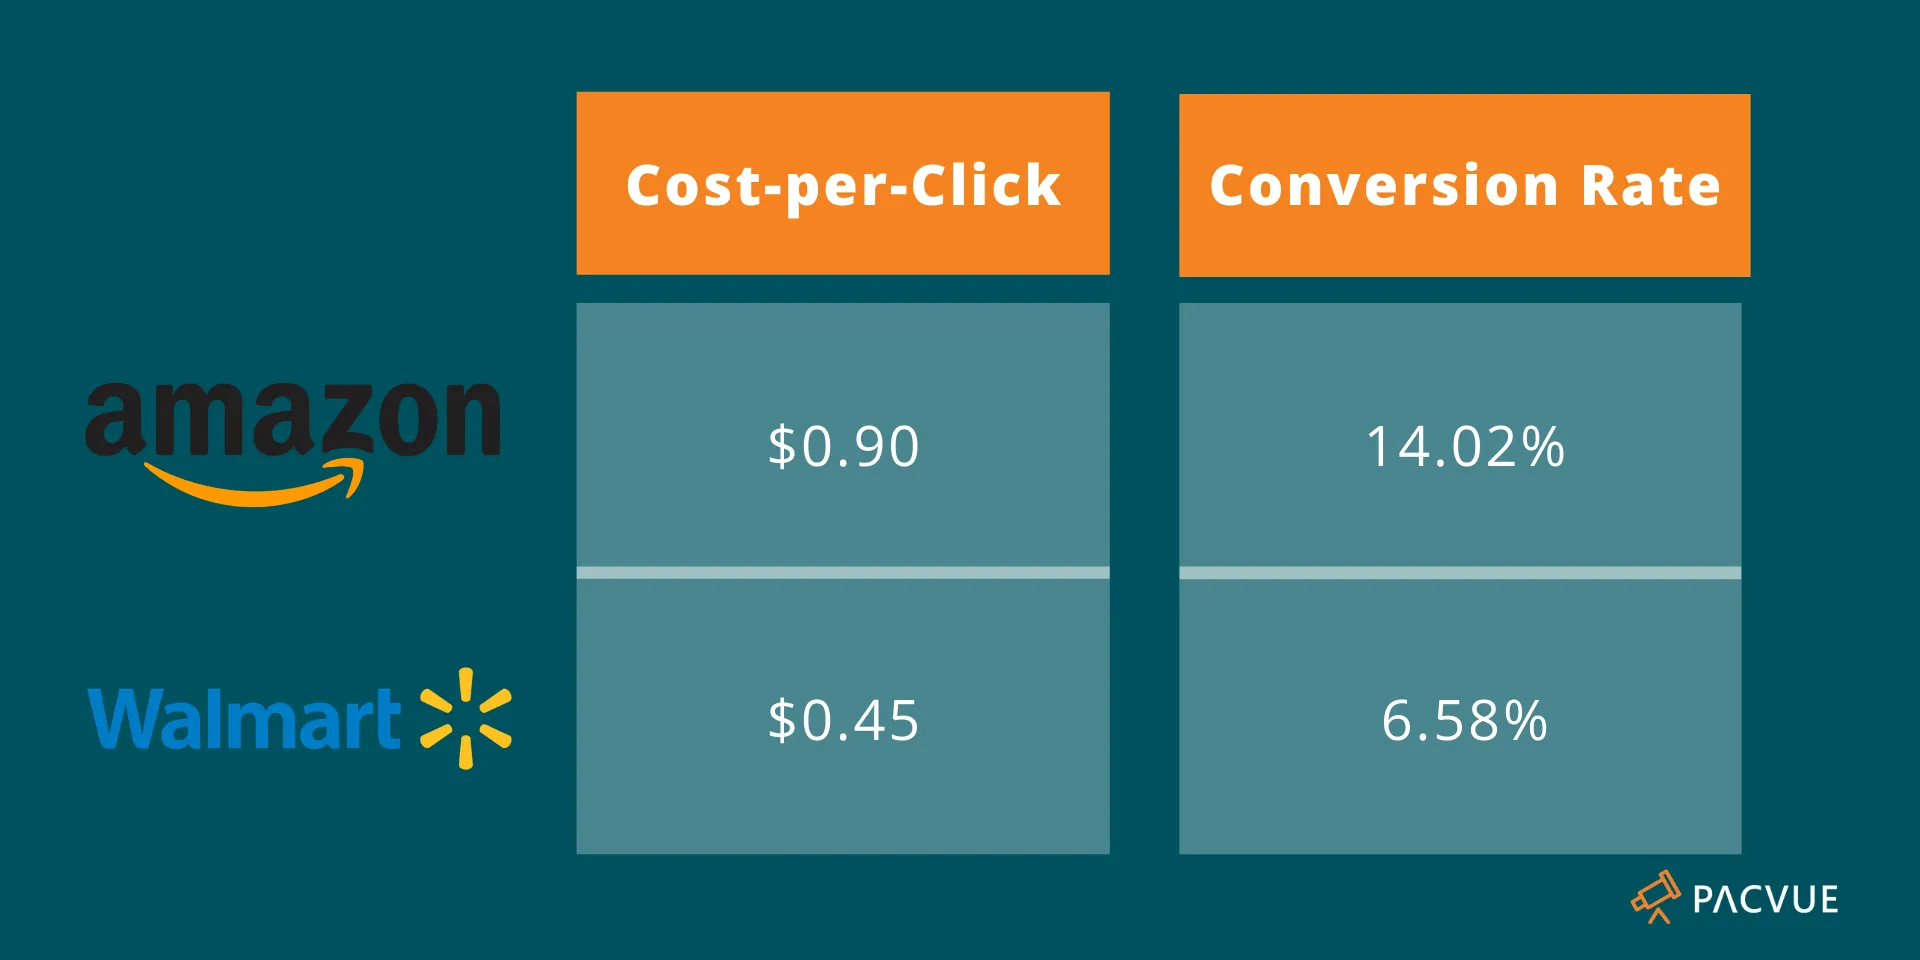
When we compared early Walmart advertising performance with the latest Amazon Sponsored Product ad performance, we found that Walmart has much lower CPCs on average across categories, about half the cost as Amazon, due to less competition on the platform. However, Walmart also has lower conversion rates, also a little less than half compared to Amazon.
Given the differences in audience and product lines, you may need to drill down to the category level to get a true side-by-side comparison of performance. For example, when we compared several Home Care & Appliance brands on both platforms and normalized for the same attribution window, we found that brands achieve a slightly higher ROAS on Amazon than Walmart, at $2.35 to $2.30 respectively. Interestingly, Amazon had a 41% higher average sales price, so while advertising may be more expensive on Amazon, brands are seeing more success with higher-ASP items on the Amazon marketplace than on Walmart.

Key Takeaways
It can be difficult to compare performance on Walmart and Amazon due to the differences in their attribution model.
Walmart’s attribution model includes all purchases from your brand after a customer has viewed your ad, regardless if they clicked on it or not. Amazon, on the other hand, attributes only sales made as a direct result of clicking an ad. Pacvue can help normalize this data and provides additional attribution metrics for both platforms, so you can gain a side-by-side comparison automatically, rather than pulling your data manually.
Due to the platform’s infancy, the competition on Walmart is still low. This results in lower cost but also lower click-through rates and conversion rates compared to Amazon. We recommend drilling into the specifics of your campaigns and tracking your growth over time to assess how well your Walmart strategy is working.


