Win Your Category and Unlock Growth on Amazon
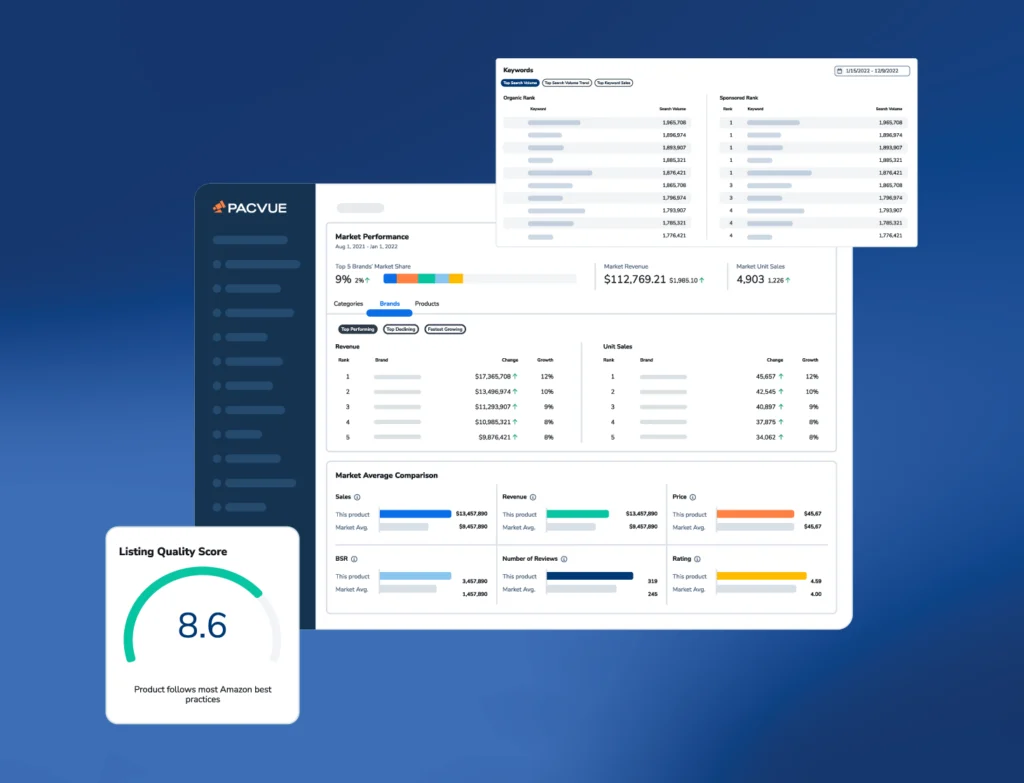
Pacvue Market Insights takes you beyond market share tracking with real-time keyword, pricing, and product insights that reveal why performance is shifting and what to do next.
From market noise to clear direction
Most market share tools tell you what happened. Pacvue Market Insights shows you why it happened and how to respond.
Built on Helium 10’s decade of Amazon tracking across more than 600 million products, Market Insights turns noisy marketplace data into a single, actionable view of your category. Track pricing shifts, market share movement, keyword surges, and emerging competitors in real time and connect those insights directly into Pacvue’s Commerce OS for faster, more informed execution.
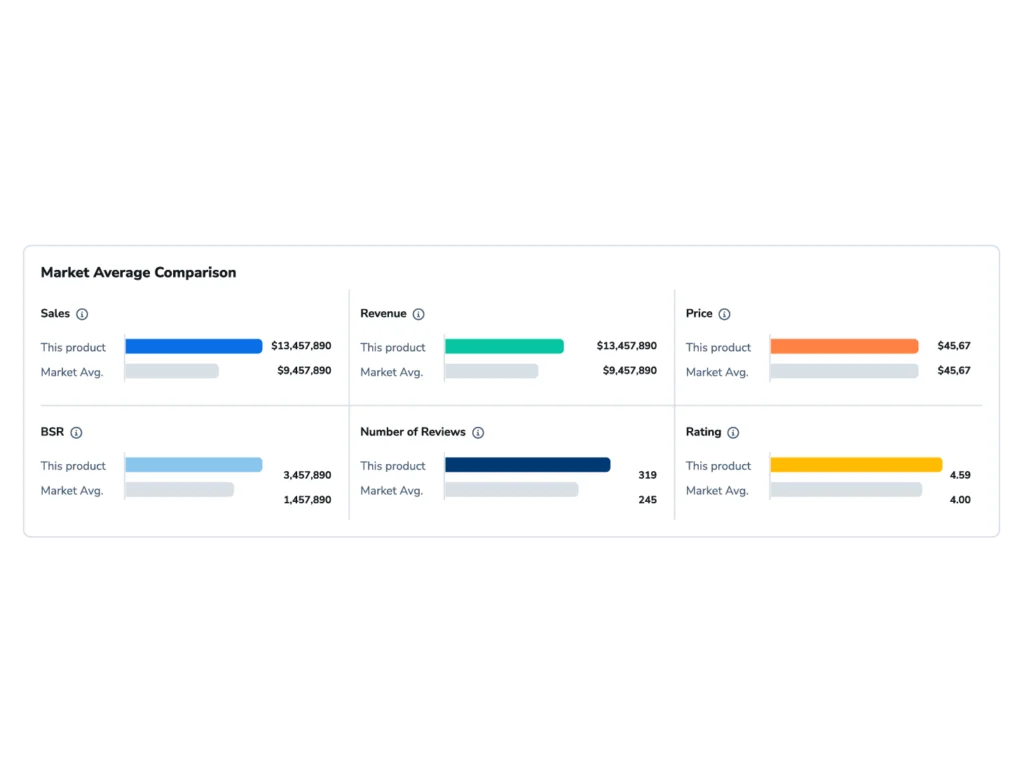
Understand your category and benchmark performance
Get a real-time view of your market to see exactly how your brand compares to competitors across pricing, sales, and share.
-
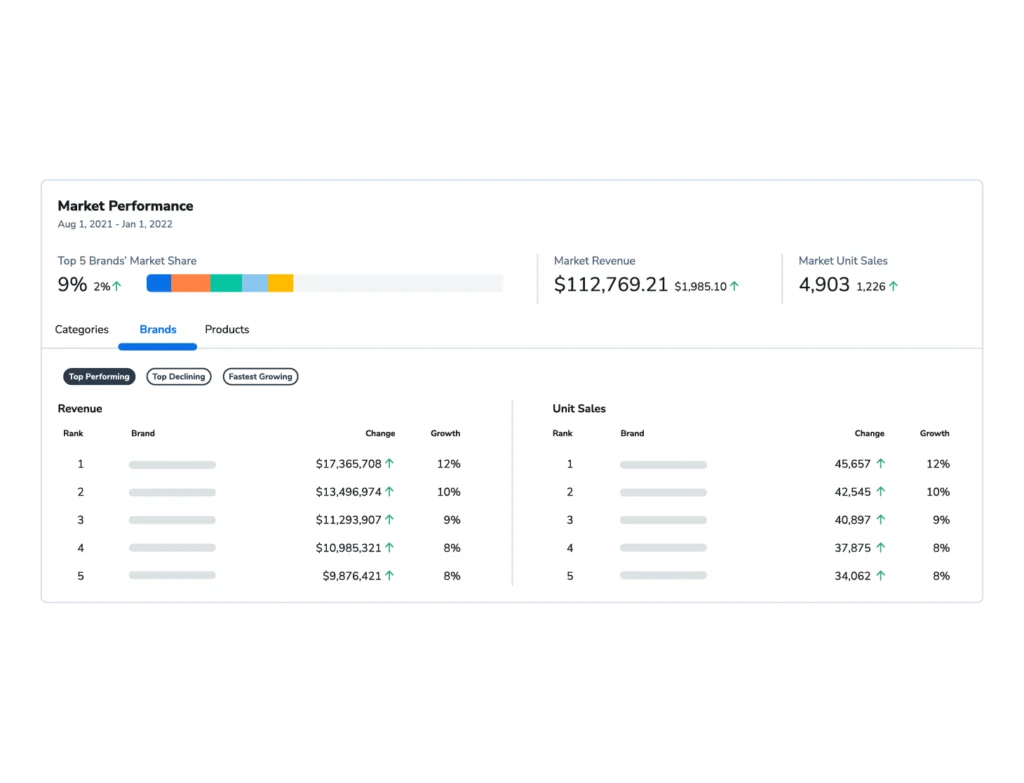
Category Overview
Monitor category and subcategory performance in real time to identify growth or contraction and stay ahead of market shifts.
-
Share and Revenue Trends
Compare share and sales velocity against your competitors to surface gains, losses, and the drivers behind them.
-
Pricing and Positioning
Understand how pricing impacts share and conversion so you can optimize for both margin and growth.

Find the keywords driving your category forward
Identify the search terms driving category growth and see how your brand ranks across key keywords. Keyword Intelligence connects keyword data with sales outcomes to help you stay visible where it matters most.
-
Top Performing Keywords
Identify your highest-converting organic and sponsored keywords and track how ranking shifts are impacting performance
-
Search Trends
Spot emerging search behavior and keyword surges that reveal shifting shopper intent.
-
Competitive Keyword Insights
Compare your keyword rank and share of voice against competitors to guide bidding and content strategy.
Turn product-level insights into action
Go deeper into product-level performance to see what drives conversion, share, and profitability. Identify your strongest listings, competitive gaps, and opportunities to expand category reach.
-
ASIN Performance
Evaluate product sales, ratings, and content quality to prioritize your highest-impact SKUs.
-
Price and Share Analysis
Correlate price changes with share and performance to identify optimal pricing strategies.
-
Portfolio Optimization
Find white space and emerging subcategories to guide new product launches or reallocation of investment.
How Leading Brands and Agencies Turn Market Insights Into Measurable Growth
Unlock Smarter Budget Allocation
A leading agency used Market Insights to shift spend out of low-demand periods and into high-impact months, driving more efficient media performance.
Plan With Confidence Using Trend Data
Brands analyzed multi-year ASIN-level trends through Market Insights to guide more predictive and confident planning.
Act Faster on Emerging Market Shifts
Market Insights helped brands identify low-performing periods early so they could optimize spend before inefficiencies escalated.
Strengthen Strategy With Category Intelligence
Brands and agencies used Market Insights to understand category dynamics and improve strategic planning across key retail moments.
Delivering outcomes at scale for 70,000 brands and agencies
All case studies


Benchmark your brand ahead of Q1
Get a clear view of how your brand is moving relative to the category, not just your own KPIs.
Pacvue Market Insights reveals your estimated market share, category growth trends, rising competitors, and keyword demand shifts so you know exactly where to focus to grow.