
las cifras que movieron el mercado
Informe de referencia sobre los medios comerciales y las rebajas de verano de mediados de año de 2026
Descubre el rendimiento de cada dólar invertido en publicidad en Amazon, Walmart, Instacart y Target en el segundo trimestre de 2026 —incluidos eventos promocionales como el Prime Day—, para que puedas comparar y optimizar tus propias campañas de cara al segundo semestre y más allá.
Realiza un seguimiento de tu Amazon, Walmart, Instacart y Target rendimiento publicitario en comparación con los puntos de referencia de confianza del sector.
Obtenga una visión global de cómo los anunciantes asignaron sus presupuestos, optimizaron sus campañas y se adaptaron a los cambios constantes en el panorama comercial durante el segundo trimestre de 2026.
PacvueEl «Informe de referencia sobre medios comerciales y ventas de verano de mitad de año de 2026» ofrece un análisis detallado de las tendencias de rendimiento en las principales redes de medios minoristas. Descubre cómo los anunciantes están elaborando estrategias en torno a diferentes formatos publicitarios, ubicaciones y plataformas, con información sobre métricas clave como el CPC, el ROAS, la inversión publicitaria y mucho más.
Este informe proporciona a las marcas y agencias los datos y el contexto necesarios para identificar oportunidades, perfeccionar estrategias y mantener su competitividad.
Explora el informe
Obtén información útil sobre los minoristas
Tendencias de los anuncios de « Amazon » en el segundo trimestre
+26,5 % en la tasa de conversión de marcas patrocinadas
+8,3 % en la tasa de conversión de marcas patrocinadas durante el Prime Day, en comparación con el año anterior
+26,1 % interanual en el gasto medio diario en marcas patrocinadas
+21,2 % interanual en el gasto medio diario en productos patrocinados
Tendencias de « Walmart » en el segundo trimestre
+75 % interanual en la tasa de clics de las marcas patrocinadas
+23,4 % interanual en la tasa de clics de los productos patrocinados
-15,6 % interanual en el coste por clic de las marcas patrocinadas
+34,1 % interanual en el gasto medio diario por marca patrocinada
Tendencias de los anuncios de « Instacart » en el segundo trimestre
+22,1 % interanual en el retorno de la inversión publicitaria en display
+7,9 % interanual en el retorno de la inversión publicitaria de los Productos Patrocinados
+8,2 % interanual en la tasa de clics en anuncios gráficos
+23,8 % interanual en la tasa de clics de los productos patrocinados
Q2 Target Tendencias
+19,54 % interanual en el gasto medio diario por marca
+9,14 % intertrimestral en el gasto medio diario por marca
+5,56 % intertrimestral en el coste por clic
-5,98 % de rentabilidad de la inversión publicitaria respecto al trimestre anterior
Tendencias del segundo trimestre de Amazon yDSP
+26,6 % interanual: las ventas de productos nuevos de la marca « DSP »
+26,6 % intertrimestral en las ventas de productos nuevos de la marca « DSP »
+4,2 % interanual en el retorno de la inversión publicitaria en pantallas
+12,1 % interanual en la tasa de visitas diarias a las páginas de visualización
Amazon Productos patrocinados por categoría
Descubre qué categorías obtuvieron mejores resultados de conversión, cuáles fueron las más costosas y mucho más durante el segundo trimestre de 2026.
Perspectivas que marcan el futuro del comercio
Descubre las tendencias, los puntos de referencia y las perspectivas que están dando forma al sector de los medios y el comercio minorista.

Blog: Perspectivas comerciales para 2026.
Más información.
Blog: Cómo mantener el impulso tras las rebajas de verano.
Más información.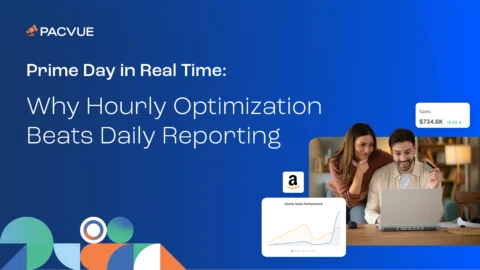
Blog: El Prime Day en tiempo real: por qué la optimización por horas es mejor que los informes diarios
Más información.Descubre el futuro del comercio conectado.
Solicitar una demoBuilt for performance.
Powered by partnerships.