
The Complete Deal Days Recap: How Amazon, Walmart, and Target Performed in the First Sales Event of Q4 2026
Discover how brands and agencies spent their advertising dollars and how much value they ultimately created during Prime Big Deal Days, Walmart Deal Days, and Target Circle Deal Days in this actionable, forward-looking report.
The Complete Deal Days Recap
Discover how brands and agencies spent their advertising dollars and how much value they ultimately created during Prime Big Deal Days, Walmart Deal Days, and Target Circle Deal Days in this actionable, forward-looking report.
-
Robust cross-retailer data
-
Actionable Deal Days insights
-
Proven framework for winning Cyber 5
Contenuto del rapporto
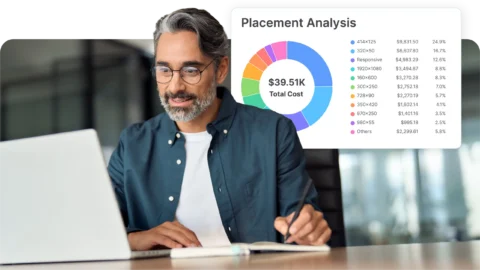
Discovery sets the stage. While Deal Days ran in early October, many shoppers first came across the products they ultimately purchased in the days and week before the event—through short-form video, social media, or off-platform advertising. Brands that invest in discovery commerce early can build an audience of warm prospects before the next sale kicks off, giving them a powerful head start.
Explore upper funnel impact.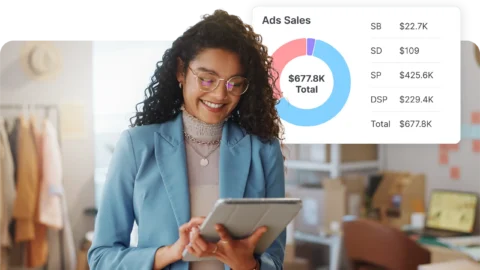
Timing was a key factor in performance. On Amazon and Target, ROAS, CVR, and CTR were strongest on Day 1 as shoppers arrived with intention, ready to take advantage of a relatively short promotional window. By Day 2, Walmart Sponsored Brands ROAS peaked, while Sponsored Products remained evenly profitable for the retailer through the remainder of the event.
Leverage dayparting and scheduling.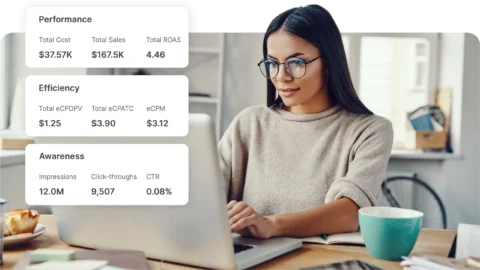
Essentials were costly and competitive. Health & Household was the most expensive category to advertise in, while Grocery & Gourmet had the highest CVR. As shoppers continue to prioritize stocking up on everyday goods—particularly during sales like Deal Days and Cyber 5—auction pressure will remain elevated.
Explore category trends.We treat Prime Big Deal Days, Walmart Deal Days and Target Circle Deal Days as the dress rehearsal for Cyber 5. They show us which offers, creative and keywords actually move, and they fill our remarketing audiences with shoppers who looked but didn’t buy. We also plan discounts across all of them so October doesn’t undercut November. By the time Black Friday hits, we already know what works and who to go after.
Deal Days 2026, by the Numbers
Based on Pacvue’s Performance Data
Sponsored Brands, Amazon Ads
Sponsored Products, Walmart
Target
Risultati commerciali su larga scala per oltre 70.000 marchi e agenzie
Tutti i casi di studio


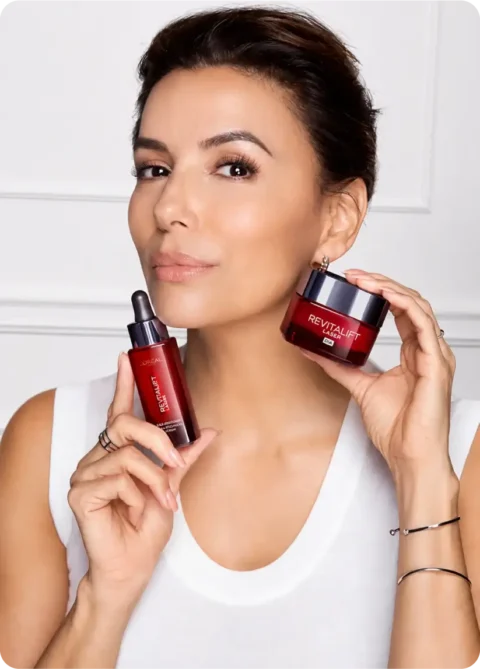
L’Oréal UK e Publicis Media UK hanno collegato direttamente i segnali relativi alla disponibilità dei prodotti nei punti vendita all’esecuzione delle campagne pubblicitarie tramite il Commerce Media OS di Pacvue, garantendo che la spesa pubblicitaria fosse concentrata in modo dinamico sugli annunci disponibili in magazzino e idonei all’ Buy Box.

Per accelerare la crescita tra i nuovi clienti del marchio sulle principali piattaforme di retail media giapponesi, Itsumo ha implementato Pacvue come sistema operativo di commercio basato sull’intelligenza artificiale, integrando Sponsored Ads, Amazon ,DSP e AMC per eliminare i colli di bottiglia SQL e attivare rapidamente i segmenti di pubblico.
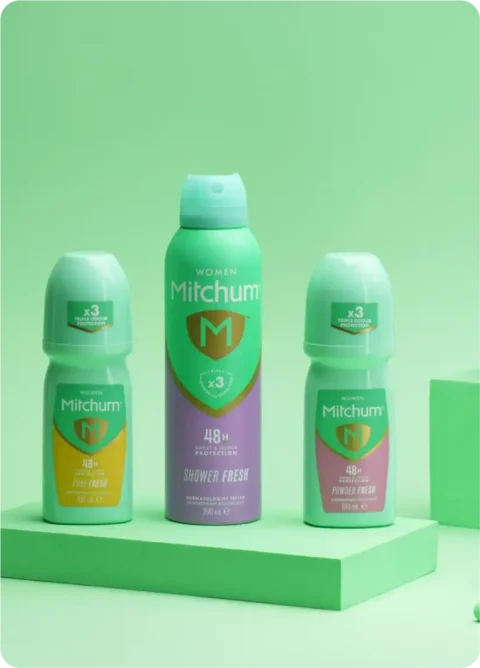
Grazie PacvueCommerce Operating System Pacvue, il marchio Mitchum di Revlon e Horizon Media hanno integrato gli investimenti pubblicitari con i segnali di commercio in tempo reale, passando da interventi correttivi reattivi a Amazon proattiva Amazon che abbraccia l'intero funnel.
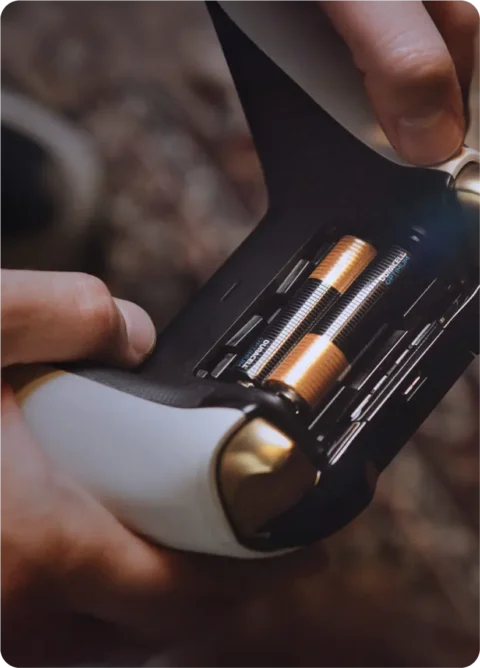
Grazie alla sincronizzazione delle soluzioni Commerce e Advertising di Pacvue, Duracell ha implementato un processo di automazione orientato alla redditività, che include il Net PPM%, l’ Buy Box e regole di gestione delle scorte, al fine di proteggere i margini e recuperare oltre 1 milione di dollari di ricavi persi su Amazon in sei mesi.